Understanding the global atmospheric methane surge: insights from satellites
By Lakshmi Bharathan, Theo Morgan Lundie, Robert Parker and Paul Palmer …
Over the past decade, atmospheric methane has steadily increased, reaching record-breaking values in 2020 and 2021. The reasons for this rapid increase in atmospheric methane is still puzzling scientists, with potentially profound implications for understanding future climate. Without better knowledge we cannot determine how it will impact the effectiveness of the Global Methane Pledge. In EOCIS, we have extended the long-term satellite-based climate data record of atmospheric methane, enhanced coverage of the existing data to probe key regions and advanced our modelling capabilities to better understand observed changes.

Why is methane important?
Methane (CH₄) is the second most important greenhouse gas after carbon dioxide (CO₂) in driving climate change. Although in the atmosphere there is only one methane molecule for every 200 CO₂ molecules, each methane molecule has a warming effect 80 times larger over a 20-year period. Methane concentrations have already increased by around 2.6 times from pre-industrial levels, making methane responsible for about 0.5°C of current global warming. Unlike CO₂, which lingers in the atmosphere for centuries, methane breaks down in about 12 years. This means cutting methane emissions can bring rapid climate benefits, making it one of the most effective ways to slow down global warming in the near term.
Methane’s potency as a greenhouse gas isn’t just a problem on its own; it also carries the risk of triggering dangerous feedback loops. One example of this can be found in the Arctic, where carbon locked in frozen ground is beginning to be released. As surface temperatures increase, permafrost thaws, releasing more methane, which in turn accelerates warming – potentially pushing us toward critical climate tipping points. Wildfires offer another example of climate feedback loops: as rising temperatures make forests drier and fires more frequent, massive amounts of greenhouse gases are released into the atmosphere, further accelerating climate change. This underscores why tackling methane emissions is so crucial – we’re not just fighting its direct warming effects, but also racing to prevent these self-reinforcing cycles from spinning out of control.
Currently global methane emissions are split about 50:50 between natural sources and human (anthropogenic) sources. Major natural sources include wetlands, wildfires, and termites, whilst anthropogenic emissions come mostly from agriculture, fossil fuels, and waste. Because anthropogenic emissions are directly caused by human activities, these are the easiest to try and reduce. There are various international agreements to help make these reductions happen, such as the Global Methane Pledge which aims to reduce methane emissions to 30% below 2020 levels by 2030.
How do we measure methane in the atmosphere?
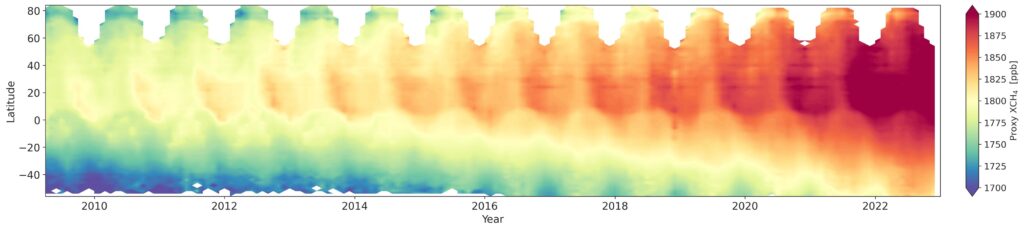
Although we can’t see methane with the naked eye, it interacts strongly with light in the infrared part of the electromagnetic spectrum. This property allows us to use satellites, such as the Greenhouse Gases Observing Satellite (GOSAT), to calculate methane concentrations around the globe by measuring changes in the sunlight reflected from Earth’s surface once it returns to space. GOSAT methane data generated by the University of Leicester has been instrumental in unlocking new knowledge about methane, allowing fresh insights into the global methane emission trends.
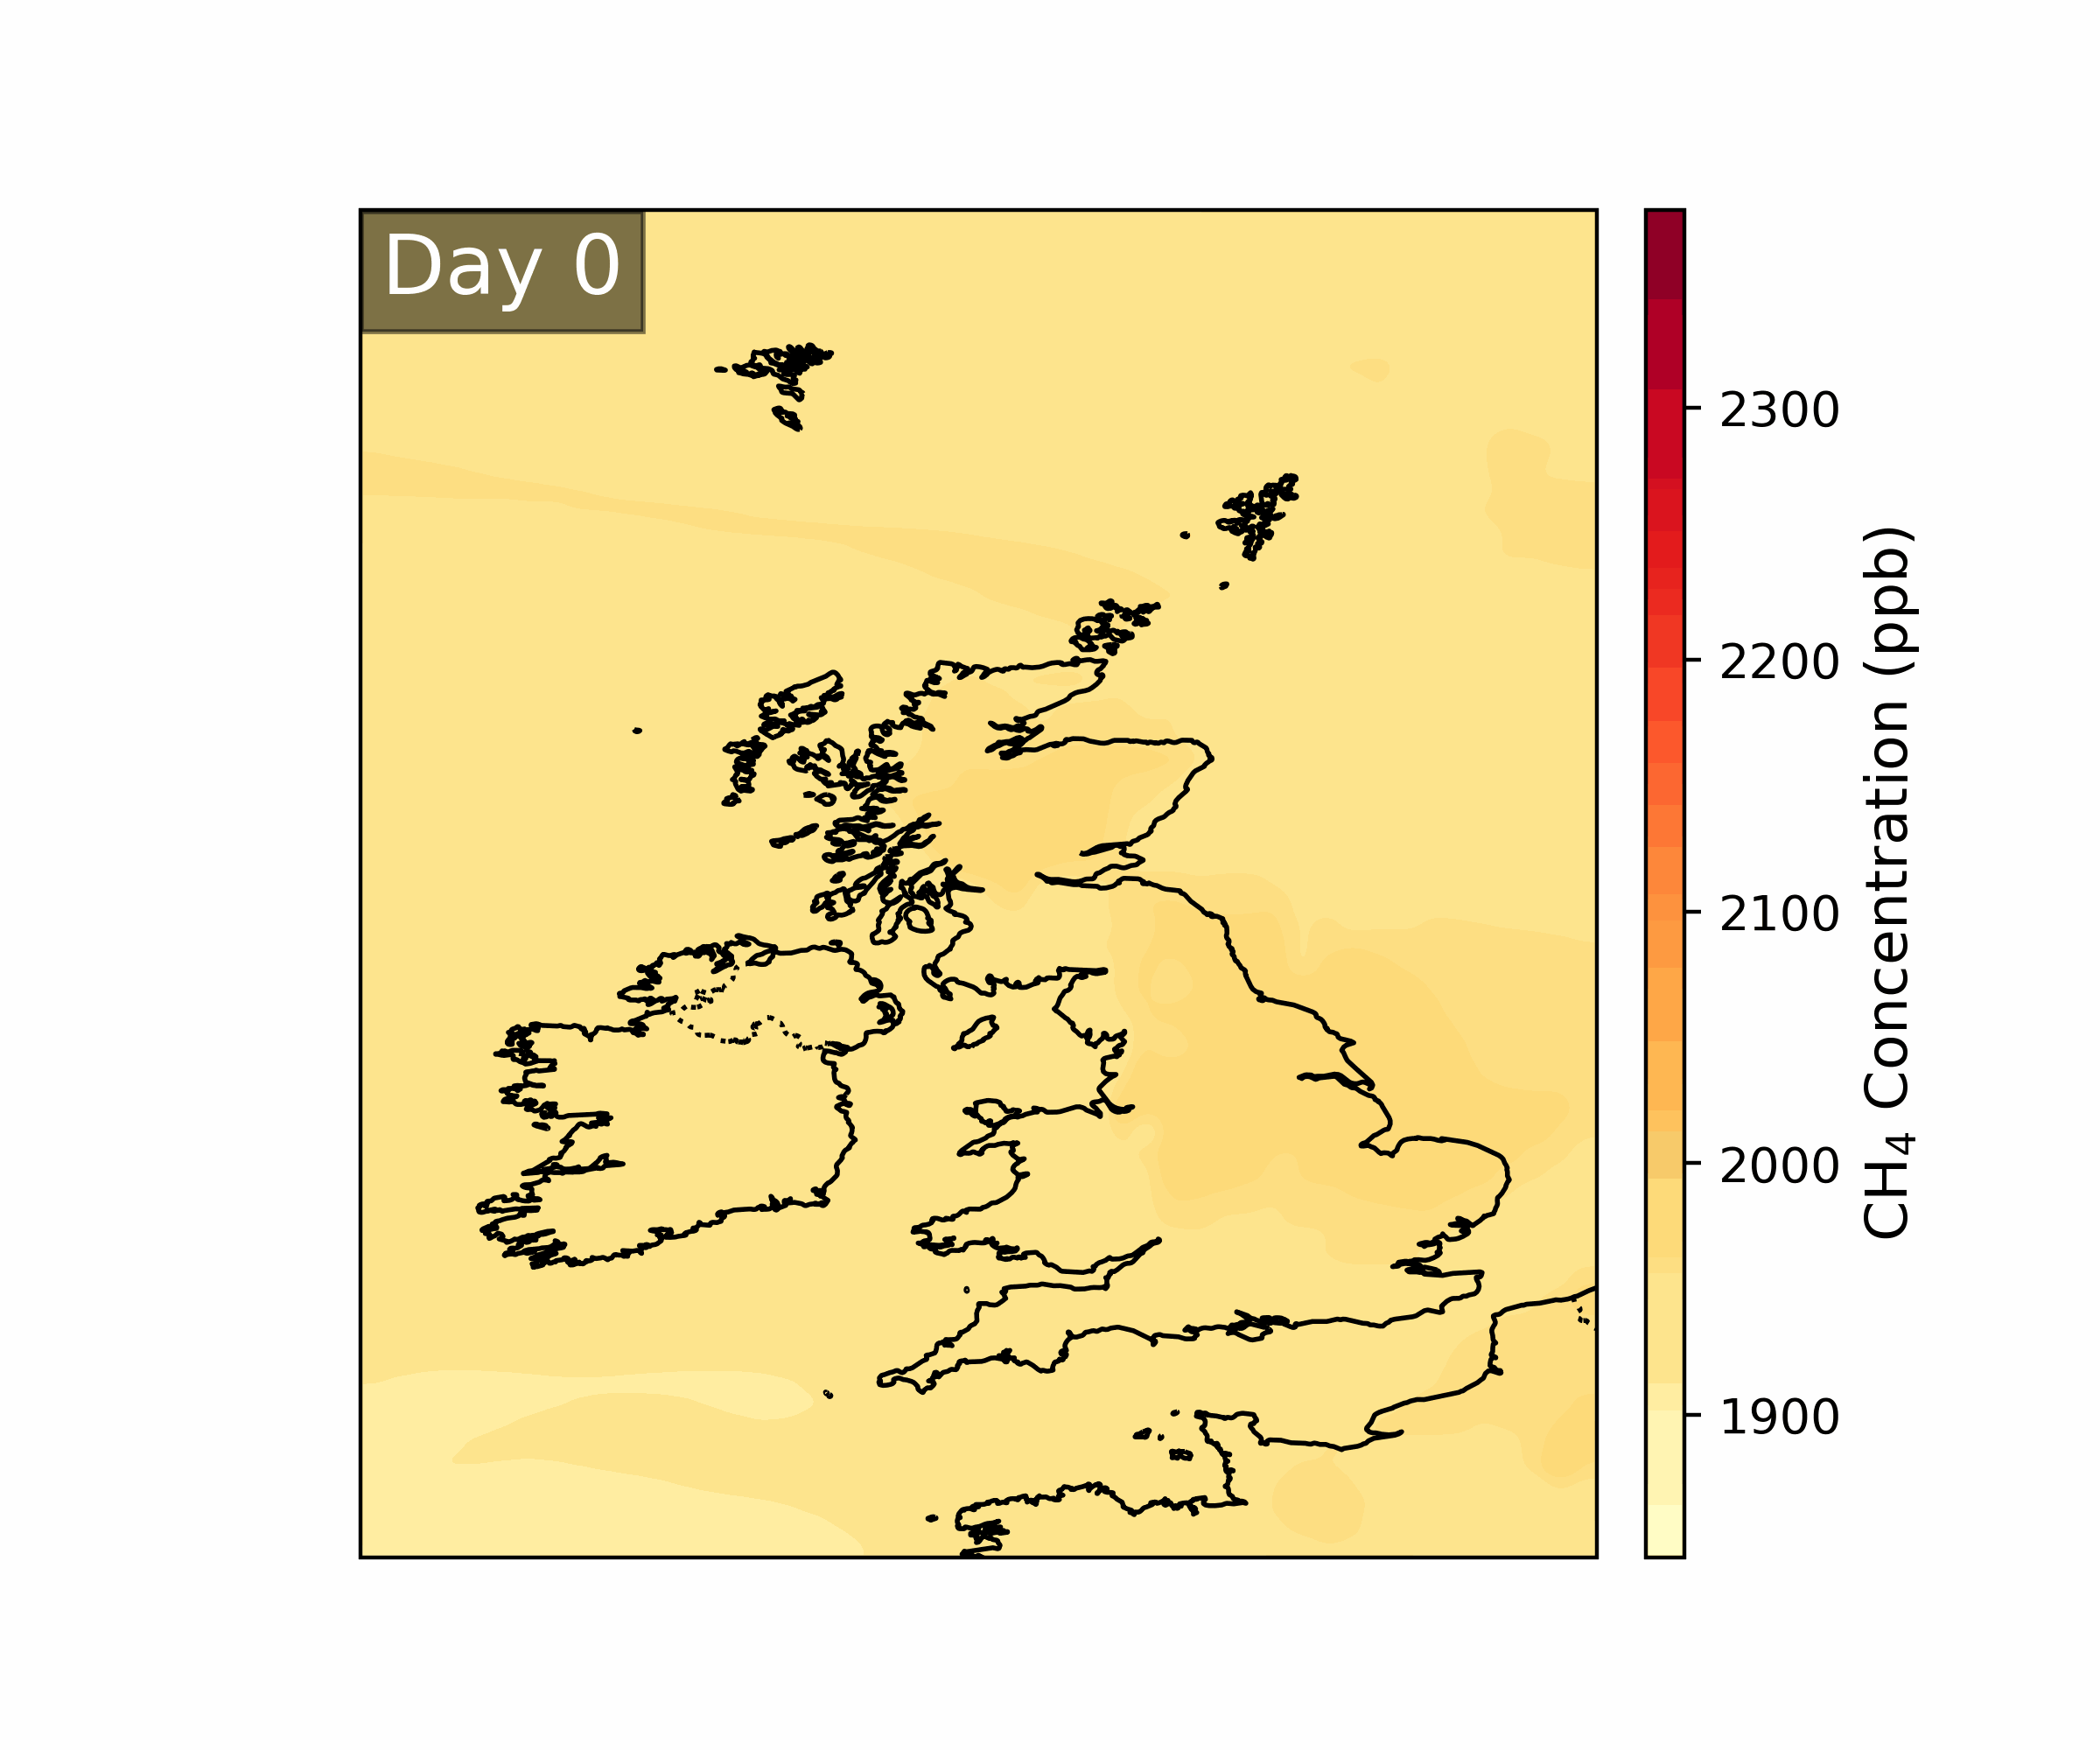
As well as measuring methane once it has been released into the atmosphere, we also want to understand where and when emissions happen. By combining satellite measurements with computer models that simulate the atmosphere (Figure 1), we can build up a picture of exactly where and how much methane is being emitted.
Challenges associated with satellite measurements in the shortwave infrared, such as those from GOSAT, are that they do not allow us to understand how methane concentrations change vertically throughout the atmosphere and these measurements rely on reflected sunlight, hence cloudy or polar night conditions lead to a lack of observations. This introduces uncertainty into our methane emission estimates and is therefore a research gap that we are keen to close! As part of EOCIS, we’ve discovered that combining thermal infrared data—which does allow us to understand vertical variations in methane—with shortwave infrared data can improve our confidence in methane emission estimates by up to 12%. At the same time, we have developed a sophisticated Genetic Algorithm which can enhance GOSAT data density without significantly impacting the quality of data by optimising the quality filters. This algorithm significantly improves data availability in the Arctic, increasing the initial volume by up to 60%, and ensures the continuity of this crucial long-term climate data record through consistent data generation from the GOSAT-2 satellite.
Record breaking growth rates – Why is methane increasing so rapidly?
In recent years, methane levels have surged at an alarming rate. The record-breaking atmospheric growth rates of 2020 and 2021 were the highest observed since the early 1980s. Scientists using satellite data have uncovered critical insights into what’s driving this rapid increase.
The Tropics, Methane, and Meteorology
The tropics are key to understanding methane emissions. More than 80% of the changes in global methane growth rate (2010 – 2019) can be traced back to emissions from tropical land areas, particularly wetlands and rainforests.
- The role of tropical ecosystems: Tropical wetlands, especially in Africa, have been shown to be emitting far more methane than scientists previously thought. Recent studies show that tropical and boreal wetlands played a major role in the record-breaking methane growth in 2020 and 2021. Warmer temperatures and increased water storage—likely driven by climate change—expands wetland vegetation, boosts organic matter decomposition and microbial activity, and amplifies wetland methane emissions. While warmer temperatures speed up methane-producing microbes, increased water levels create low-oxygen conditions that help methane build up. However, current wetland models underestimate these emission surges, meaning the real impact could be even greater.
- The La Niña effect: The recent methane surge (2020 -2022) is also linked to La Niña-driven flooding. La Niña events increase rainfall in some tropical regions, expanding wetlands and boosting microbial activity that produces methane. Meanwhile, methane emissions from North America, Europe and Asia have decreased, further highlighting the importance of tropical sources.
- Link to Rainfall and ocean temperatures: The increased methane emissions from East Africa during the 2019 short rains were so significant that they accounted for over a quarter of the entire global increase in methane emissions for that year. East Africa’s methane emissions, largely from its wetlands, are heavily dependent on rainfall patterns. These rainfall patterns are, in turn, connected to temperatures in the Indian Ocean.
Regional Emissions and Methane Hotspots
Methane emissions vary significantly across different regions, with new satellite data revealing important trends:
- Tropical Africa: A major contributor to global methane growth. Wetland expansion, particularly in regions like the Sudd swamp, located in South Sudan, is responsible for a large portion of the increase. Changes in water levels and rainfall patterns—not fully captured by current emission models—suggest that methane emissions from these areas are higher than previously estimated.
- Brazil and the Amazon Basin: Methane emissions from Brazil, particularly the Amazon basin, significantly increased between 2010 and 2018, correlating with rising temperatures. The Amazon alone contributed substantially (~24%) to the global methane increase during this period, and its temperature sensitivity raises concerns about future emissions. These increased emissions are linked to sources like wetlands, which bottom-up models can’t fully explain, highlighting the need for further research.
- China: While China has made some progress in slowing the growth of methane emissions, overall emissions are still rising. Studies have highlighted the need to address fugitive emissions from abandoned coal mines and to investigate the increasing emissions from rice and aquaculture activities.
- Arctic and Eurasia: The Arctic is warming much faster than the global average and northern permafrost contains vast reserves of carbon – about twice the amount currently in the global atmosphere. Based on long-term satellite observations, researchers are studying how methane emissions from thawing boreal permafrost is influencing local weather and water systems as the climate warms, which in turn feeds back to further emission.
Challenges and opportunities
Poor satellite vision over the Arctic. Although satellites can provide data around the whole globe, they often struggle to provide ample observations over polar regions, especially in winter, due to reduced sunlight, increased cloud cover, low signal to noise ratio, and high surface albedo.
Modelling wetland emissions is improving but still has challenges. Models fail to capture the true extent of methane release, particularly over Africa, likely because they don’t accurately represent the size and seasonal changes of wetlands. To address these challenges, we need better data on wetland extent and how it changes over time. Satellite observations and remote sensing techniques can play a crucial role in providing this information.
Ocean data to monitor methane. Since ocean patterns help determine local rainfall and temperature trends, we may be able to predict future methane spikes by tracking these oceanic shifts — essentially creating an early warning system for this powerful greenhouse gas.
Final Thoughts
As global temperatures rise, tackling methane isn’t just about reducing its direct warming effect — it’s also about preventing dangerous feedback loops that could push the climate beyond irreversible tipping points. Reducing emissions from fossil fuels, improving agricultural practices, and enhancing methane capture from landfills are among the key strategies. However, continued scientific research and satellite observations are essential to pinpoint the sources of rising methane and develop targeted mitigation strategies.
The rapid rise of atmospheric methane is a pressing climate challenge, but advancements in satellite remote sensing are helping us unravel its complexities. The University of Leicester’s GOSAT Proxy methane data has long played a key role in identifying methane hotspots and improving our understanding of global emission trends. Thanks to the EOCIS project, we’ve broadened this research, extending the existing dataset and incorporating additional data from the GOSAT constellation (GOSAT-2), thus ensuring the ongoing development of long-term methane monitoring capabilities.